Figure Template
1. All figures (including photographs) must be numbered consecutively in Arabic numerals. Each figure must be mentioned in the text in sequential order and should be inserted immediately following the paragraph in which it is first referenced.
2. All figures (including photographs, graphs and diagrams) must be of high resolution and quality. Figure legends must be placed below the corresponding figure, not within it. The size of all letters and symbols should be appropriately fitting figures.
3. The sub-figures should be labeled with lowercase letters in parentheses (e.g., (a), (b), (c)...). Description of each sub-figure within the main figure caption should be separated by semicolons. When mentioned in the text, the sub-figures should be cited as Fig. 1a, Fig. 1b-c, etc.
4. The notation for physical quantities must be consistent between the figures and the main text. Symbols representing variables should be in italics, while descriptive text, units, and labels should be in normal font.
5. Use a comma as a thousands separator for integers greater than 9999. A space must be inserted between the numerical value and its unit. It is recommended that the number of significant digits of data be uniform.
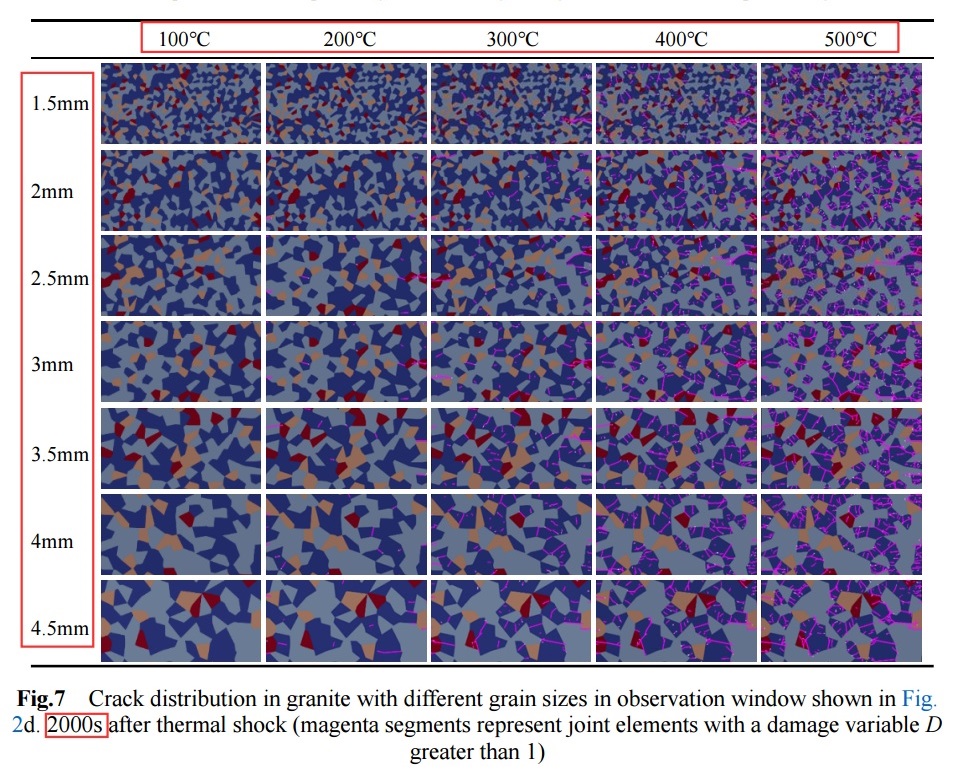
1.5 mm, 2.0 mm, 2.5 mm, 3.0 mm……
100 ℃, 200 ℃, 300 ℃……
2000 s ……
6. The format of figure and their captions in the same article should be consistent. This includes consistency in axis design, such as the number of coordinate axes and the direction of tick marks, etc.
7. For line graphs (and other graphs with axes), each axis must have a clear title and scale. The axis title should be centered along the axis. Only the first word of the title should be capitalized. Physical quantity symbols within the title should be in italics, while all other text (including the quantity name and the word per) should be in normal font. The unit, if applicable, should follow the physical quantity and be placed within parentheses, e.g. (kPa), (m/s).
8. A figure showing national boundaries must be drawn based on the latest standard base map. Maps involving boundary conflicts should be avoided. It is recommended to use base maps downloaded from official websites (https://www.tianditu.gov.cn/, http://bzdt.ch.mnr.gov.cn/) and mark the approval number.
Examples:

Fig. 1. The relationship between elastic strain energy and dissipative strain energy and input strain energy: (a)5 MPa; (b)10 MPa; (c)20 MPa; (d) 30 MPa.
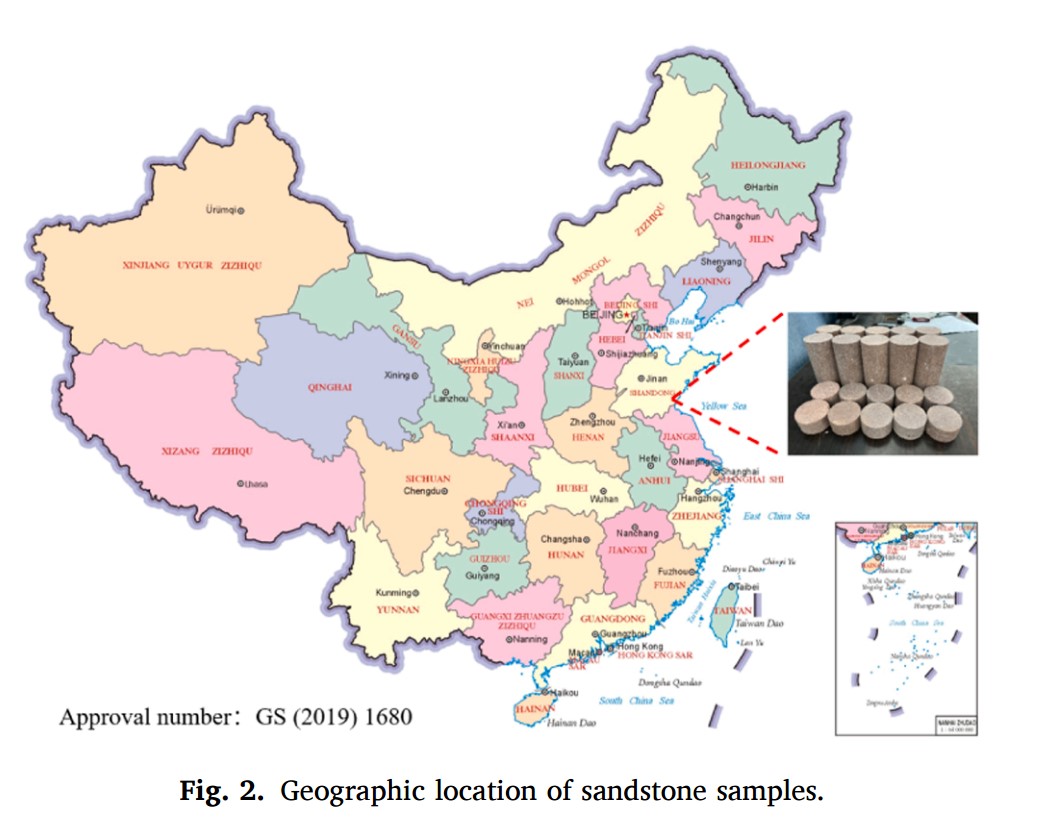
Table Template
1. The tables should be in three-line table format.
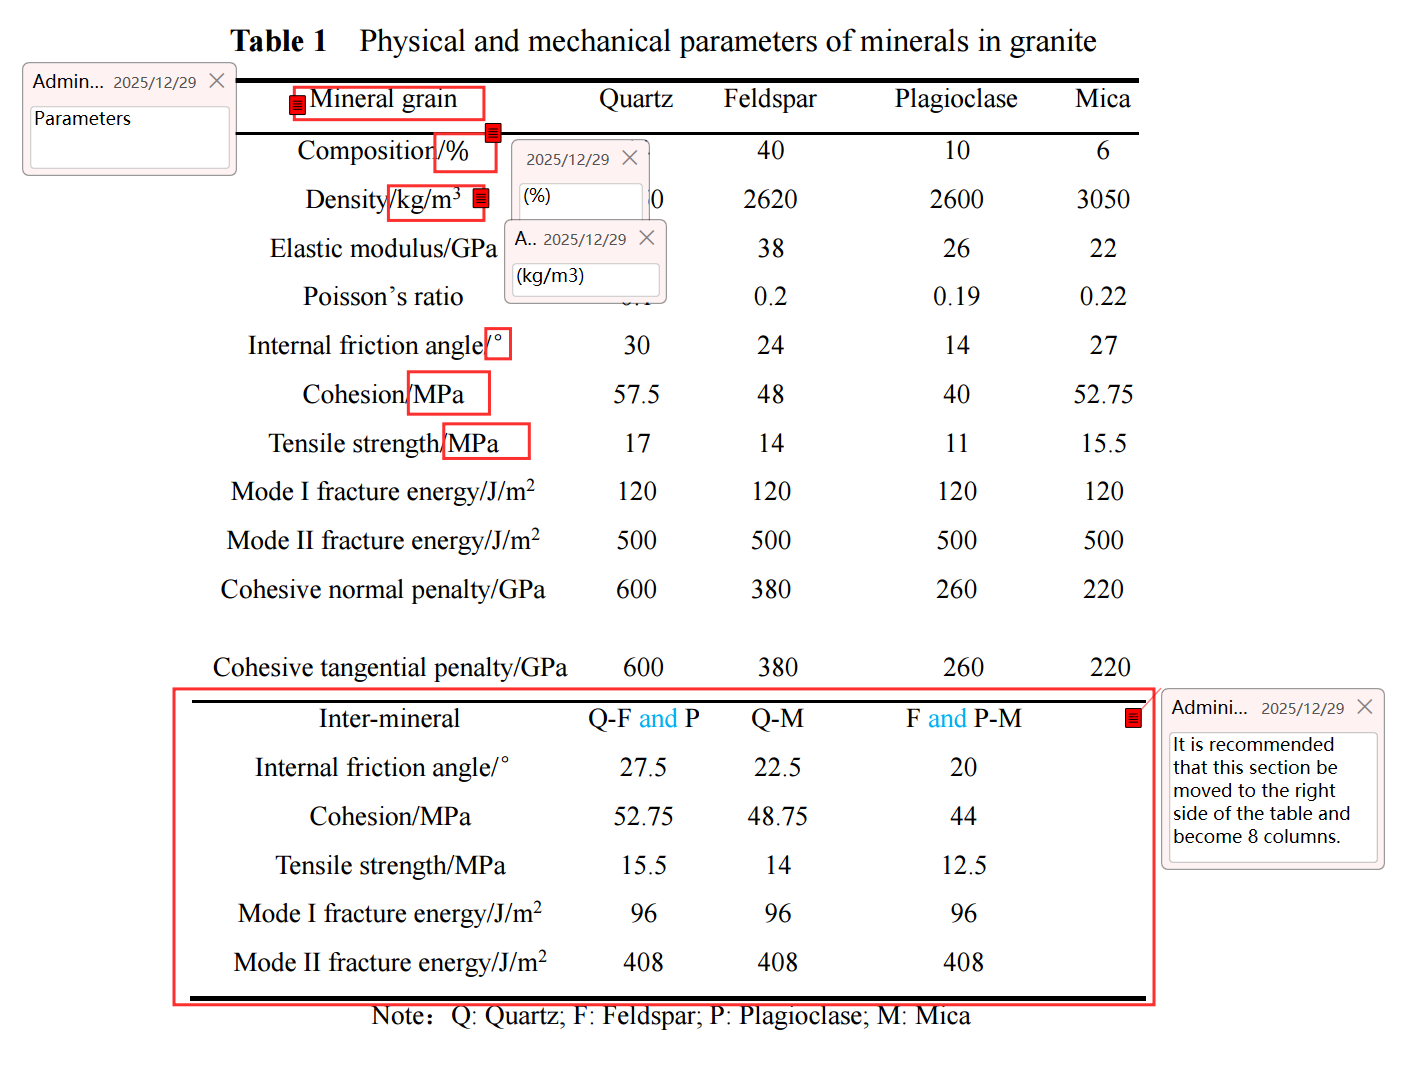
The header of the original table is changed to:
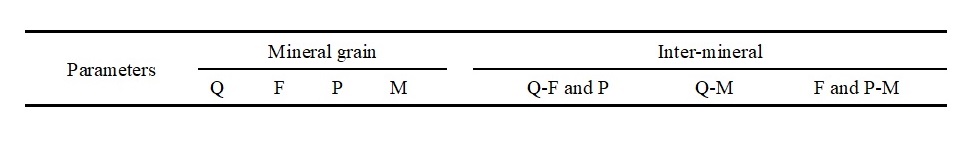
2. Units shall be presented within parentheses. The same unit in each row of the same column is moved to the table header.

Equation Template
1. The equations should be numbered sequentially as (1), (2), (3),...
2. It is recommended to use parentheses to indicate the Eq. (1), Eqs. (2) and (3) etc.
3. Define abbreviations upon first mention.
4. Mathematical constants whose values remain constant (e.g., e, π), mathematical symbols (e.g., tan, d, exp, ln, lg) and the abbreviation of English words (e.g., max, min) are in normal font.